Data Visualization Studio
Production-ready interactive data visualizations.
We design and build bespoke interactive visualizations for real data and real users. Engineered for production. Clean, maintainable code your team owns. Acceptance criteria defined upfront. Predictable delivery.
Share your dataset and project goals. Get interactive preview directions to evaluate fit before committing.
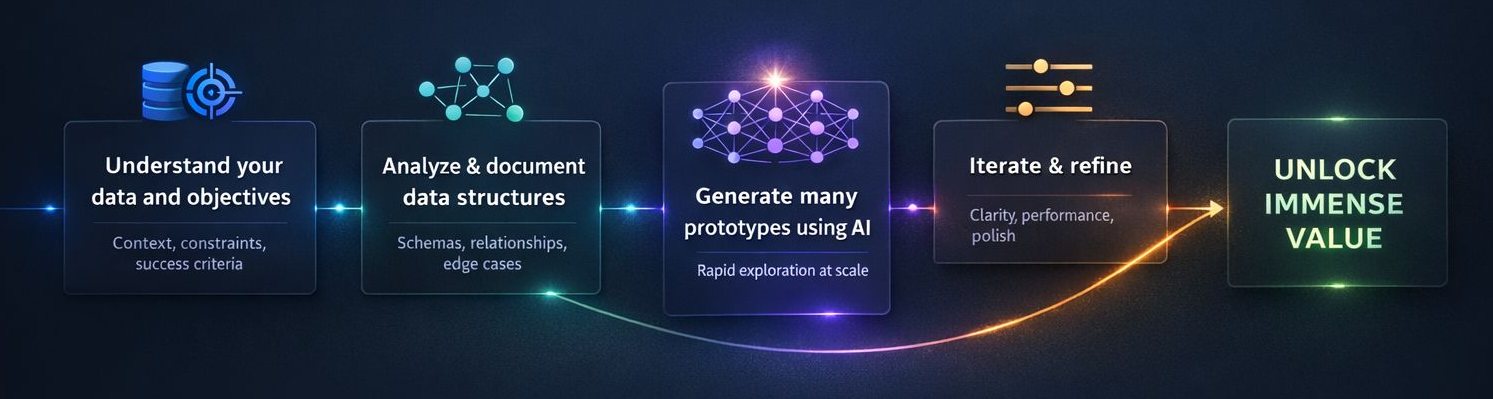
— Data Visualization Sprint Process —
Through this process, we move from raw data to production-ready visualizations, unlocking real value.
— Interactive Systems —
Examples of interactive systems built for exploration, communication, and decision-making.
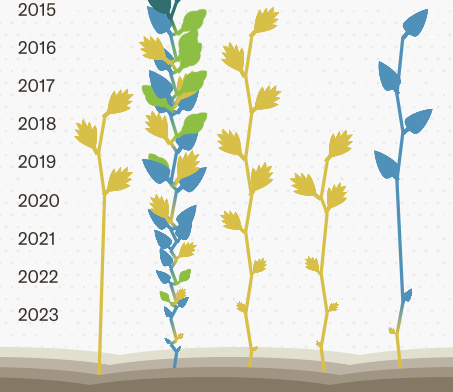
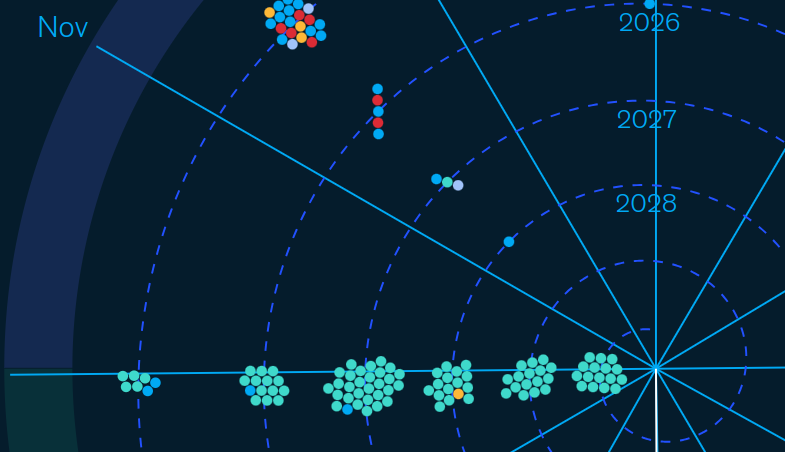
Kendeda Virtual Garden (2023)
For a foundation impact narrative, we turned grant history into an explorable "garden" where each plant represents a grantee and growth shows support over time, making complex giving patterns feel intuitive and memorable.
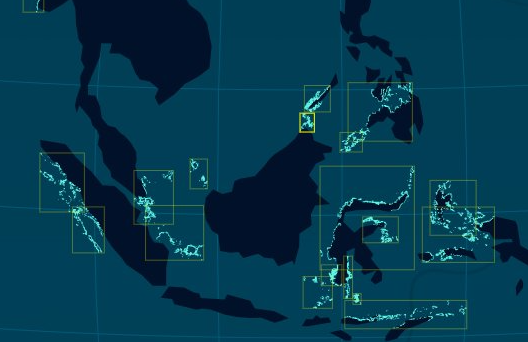
Hope Underwater — Coral Reefs Globe (2023)
For a conservation org, we built a globe-based exploration experience that lets audiences locate and understand coral reef systems spatially, supporting public communication and scientific credibility.
Supplier Diversity Explorer (2022)
For a strategy audience, we built multidimensional filtering that makes supplier diversity tradeoffs explorable, so teams can move from static recommendations to interactive scenario-thinking.
Bipartisan Infrastructure Law Navigator (2022)
For public-sector analysis, we translated a dense policy dataset into an interactive navigation system, helping stakeholders quickly find relevant programs and funding pathways.
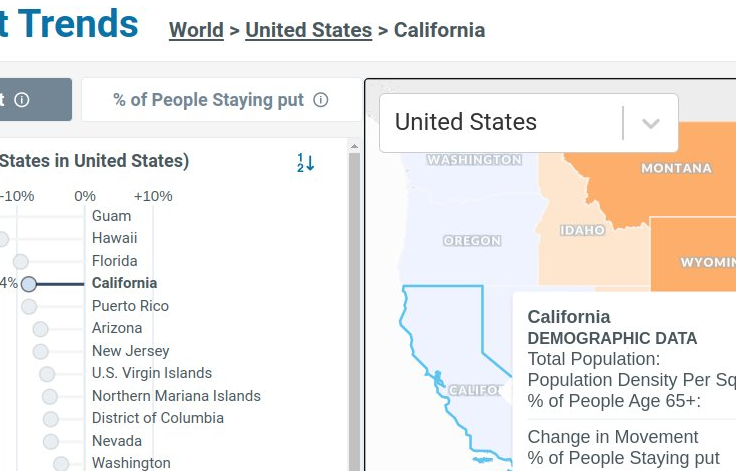
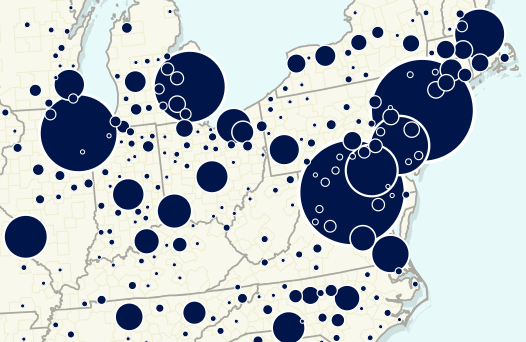
Facebook COVID-19 Mobility Dashboard (2020)
Built under intense pandemic timelines, this dashboard combined county-level mobility trends with intervention markers to support rapid decision-making and public understanding.
Max Planck — Global Superdiversity (2018)
For academic researchers, we created an explorable view of changing migration and diversity patterns across countries and cities, designed to preserve nuance while staying readable.
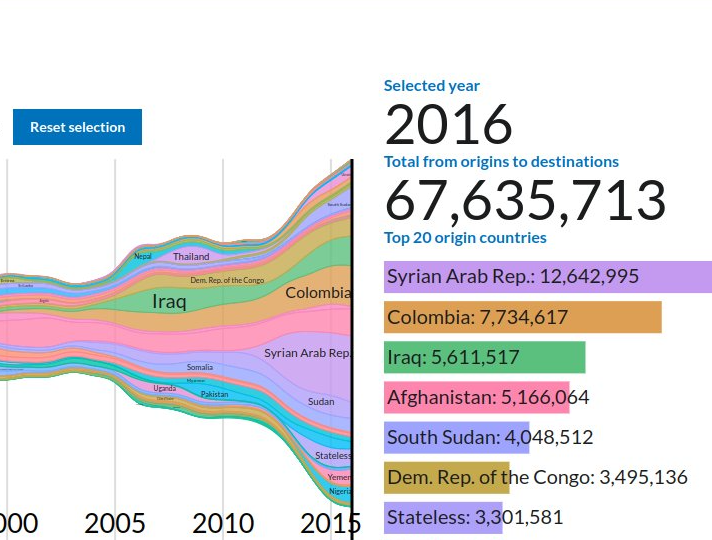
UNHCR Streamgraph Explorer (2017)
Open-source interactive system for exploring 'persons of concern' over time, with population-type filtering for fast comparisons and policy-focused context.
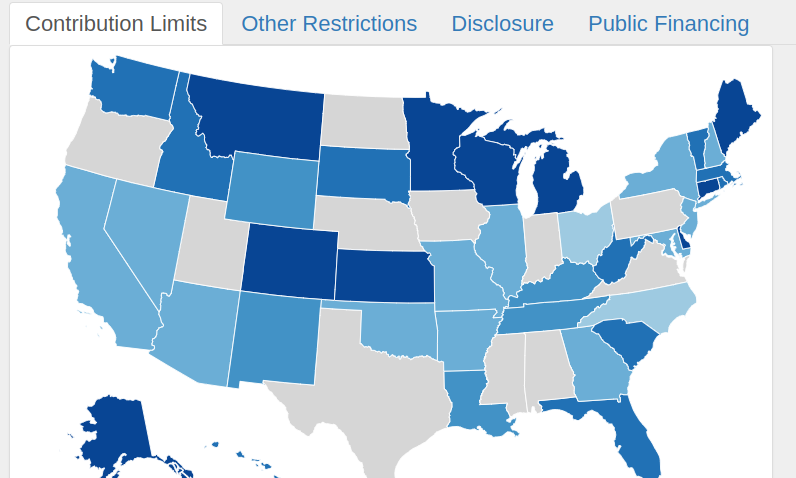
Campaign Finance Institute — Law Database (2017)
A state-by-state, year-by-year explorable database that makes campaign finance law changes legible—built for researchers and policy users who need precise, comparable detail.
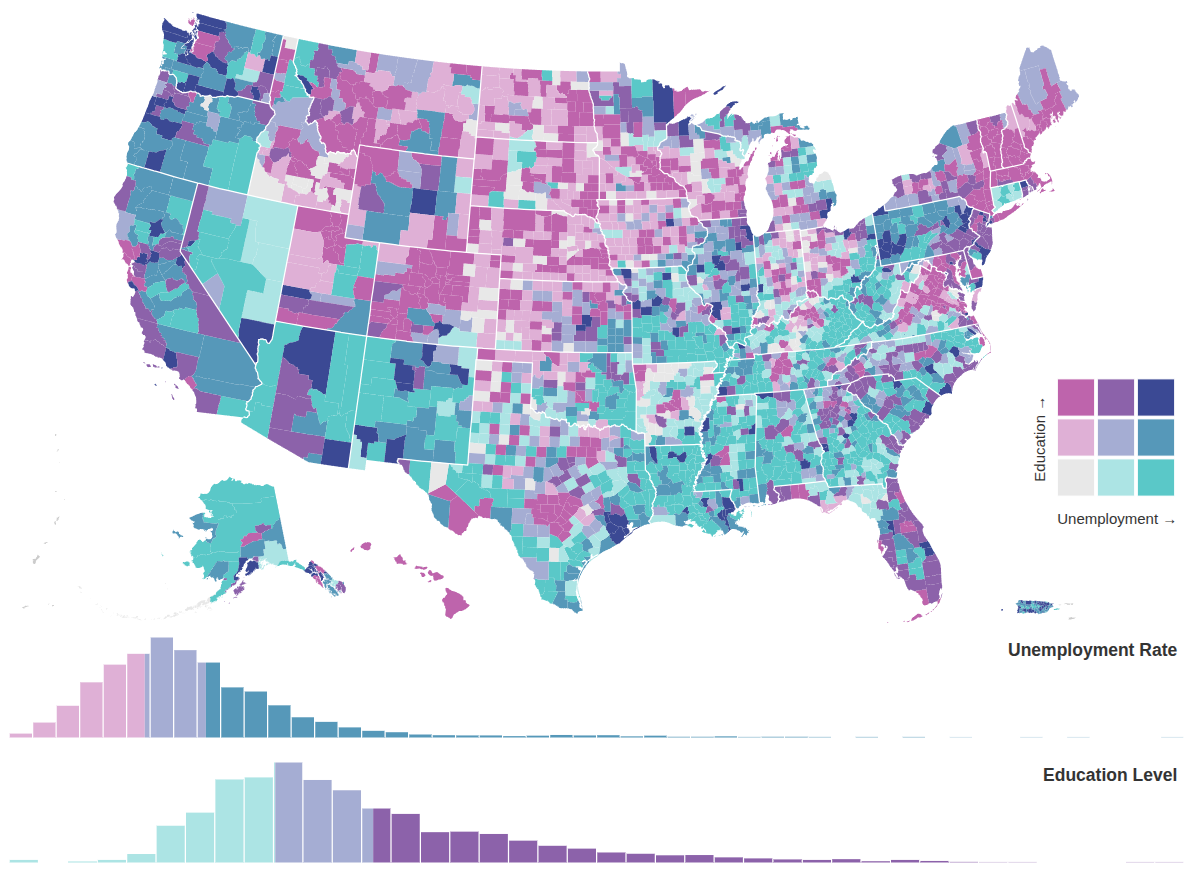
Bivariate Choropleth: Education vs. Unemployment
For geospatial analysis, we built a bivariate choropleth that lets analysts explore regional relationships between education levels and employment patterns, making multivariate geographic tradeoffs visible.
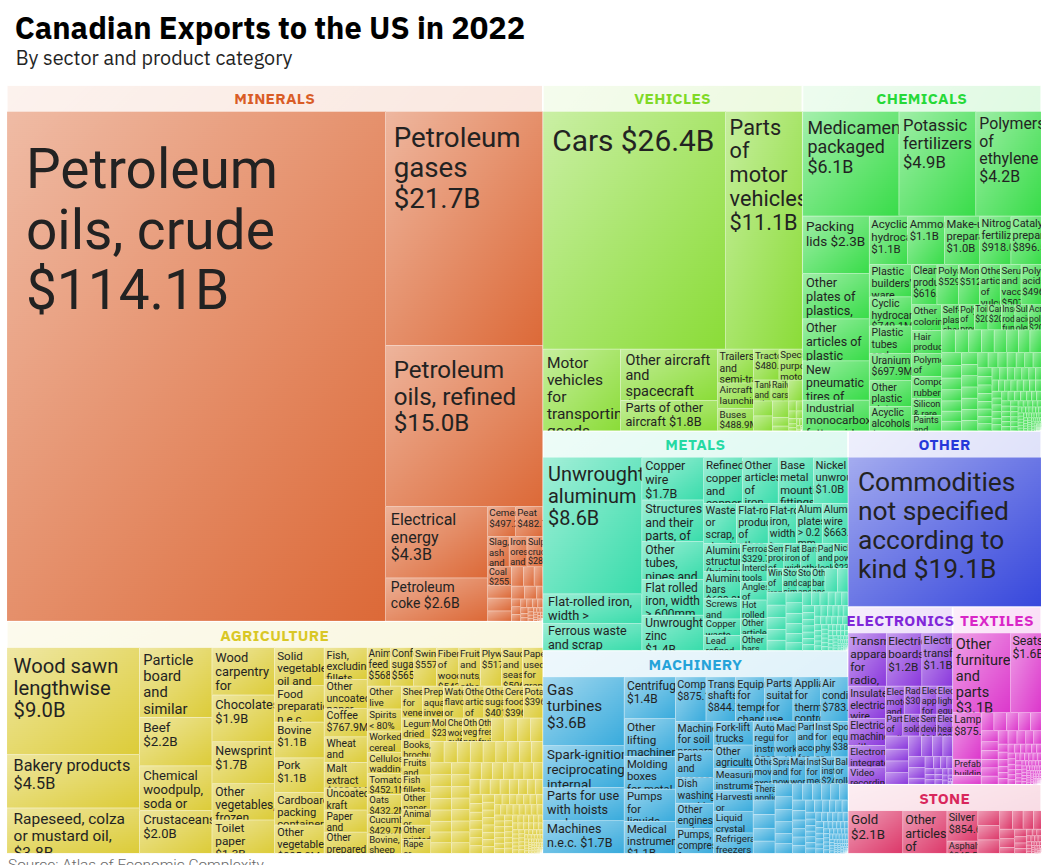
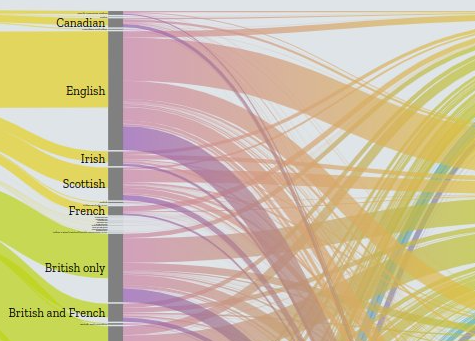
Trade Flow Analysis: Canadian Exports
A hierarchical treemap system for exploring multi-level trade data, designed to help researchers and policy analysts navigate export flows while preserving granular detail.
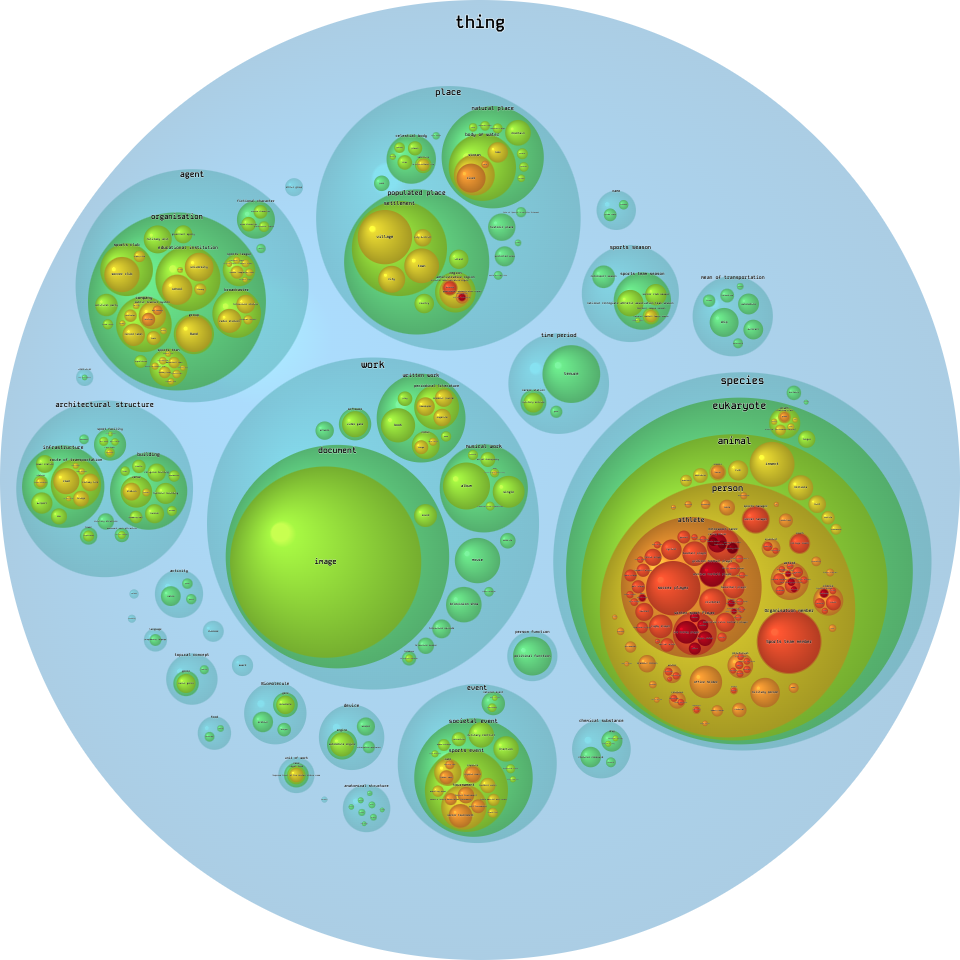
Knowledge Graph: DBPedia Ontology
An interactive circle-pack visualization for exploring a hierarchical ontology, designed so researchers can drill down from high-level categories to concrete entities while staying oriented.
Data Visualization with D3 — freeCodeCamp (2022)
A 19.5-hour production course that trains developers to build real interactive systems with D3, used for onboarding, upskilling, and internal capability building.
Led by Curran Kelleher, a senior data visualization consultant specializing in D3, React, and interactive systems.
Project Brief Submission
What You Get
A production-ready interactive visualization system: clean, documented code your team owns.
Common Project Shapes
Most projects fall into one of these three patterns.
A single, focused visualization built for clarity and depth.
Multiple coordinated views for comparison or analysis.
A visualization designed to live inside an existing site or app.
Clear Scope. Predictable Delivery. No Lock-in.
Acceptance criteria are defined upfront, before any build begins. If priorities shift, we adjust scope, not timeline or budget.
If the final deliverable doesn't meet the agreed criteria at review, the final payment is waived. You keep the work either way.
No proprietary platform. No vendor dependency. Your team owns the code and can maintain or extend it without us.
Teams where data clarity drives real decisions
This model works best for teams with real data, real users, and real deadlines.
Research & Academic Teams
The challenge
You are translating complex research into something explorable. Multivariate, temporal, or hierarchical data. Public communication or exploratory tools that still need to be technically sound.
What you get
A rigorously implemented visualization that supports exploration without oversimplification.
Publication and grant deadlines are fixed. We meet them.
Nonprofits, Foundations & NGOs
The challenge
You need to communicate impact, funding, or outcomes credibly. Grantmaking, conservation, humanitarian, or social data. Public-facing transparency and accountability.
What you get
We build systems that respect nuance, uncertainty, and audience trust.
Stakeholder expectations are high. Budgets are finite.
Consulting, Strategy & Advisory Teams
The challenge
You support high-stakes decisions for clients: public-sector, infrastructure, or policy analysis. Executive-facing dashboards and exploration tools. Tight timelines tied to deliverables or workshops.
What you get
We turn complex analysis into interactive systems that clients can actually use.
Client deadlines wait for no one. We ship on schedule.
Product & Platform Teams
The challenge
You are building data features into a real product: security, analytics, or operations platforms. Internal or customer-facing data tools. Needs go beyond charting libraries or BI tools.
What you get
Production-grade React + D3 code your engineers can integrate immediately, without a multi-month build or vendor lock-in.
User expectations are high. Time-to-market is critical.
Design Studios & Creative Agencies
The challenge
You lead the story and design. You need a technical partner who won't constrain the idea. Narrative-driven or metaphor-rich concepts. One-off or flagship interactive pieces.
What you get
We collaborate inside your vision, translating it into robust, maintainable code without flattening the concept.
Creative timelines are tight. We deliver on deadline.
Teams This Is Not For
• Teams looking for a self-serve BI tool
• Projects with undefined questions or stakeholders
• Open-ended R&D without delivery deadlines
If that's what you need, we'll tell you early.
From Discovery Call to delivery
A clear four-step process. No ambiguity. No surprises.
Discovery Call
15 min
We clarify your question, review your dataset, and provide a written scope + next-step recommendation to move forward with confidence.
Dataset Evaluation
Async review
A fast, real technical review of your data. We confirm scope, timeline, and what success should look like.
If it's not a fit, we say so. If it is, we move to build.
The Build
After the contract is signed, your build is scheduled into the next available slot. Your project timeline is reserved exclusively for you. Work begins immediately, with daily async updates and regular reviews of working builds.
Delivery + Close
By Day 5: GitHub repo handoff with code, build notes, and deployment guidance. Recorded walkthrough. Final review. Final invoice sent. Satisfaction guarantee applies.
Pre-flight checklist
We will help you get this ready on the Discovery Call if needed.
Common questions
Book a Discovery Call to explore what we can build together.
Discuss your data, goals, and project scope. Review what success looks like. No commitment required.